Client work usually stays with the firm we did it for. This page is the part we are able to share. Each one takes on a question a trading operation faces every season: whether the weather data can be trusted, what the climate signal means for a season of demand, and how production and storage shape a gas position.
EVERY STUDY · 01 / 04
PUBLISHED
The question
What a trading operation needs to know, stated up front.
✓Who relies on the answer
✓What it changes on the book
method · data · resultspublished in full ↗
EVERY STUDY · 01 / 04
PUBLISHED
The question
What a trading operation needs to know, stated up front.
✓Who relies on the answer
✓What it changes on the book
method · data · resultspublished in full ↗
EVERY STUDY · 02 / 04
PUBLISHED
The data
Public sources only, so anyone can check them.
✓Every source named and dated
✓Linked, so you can pull it yourself
method · data · resultspublished in full ↗
EVERY STUDY · 03 / 04
PUBLISHED
The method
Every step written down and repeatable.
✓Same inputs, same answer
✓Assumptions listed in plain words
method · data · resultspublished in full ↗
EVERY STUDY · 04 / 04
PUBLISHED
The result
Charts and numbers trading operations can act on.
✓Limits and caveats stated
✓Nothing hidden behind a login
method · data · resultspublished in full ↗
Case Studies
Choose a use case to see the full analysis
Each one sets out the problem it addresses and what it delivers, then opens into the charts and method behind it.
Weather Temperature Anomaly Detection Platform
Knowing Which Data You Can Trust
The problem
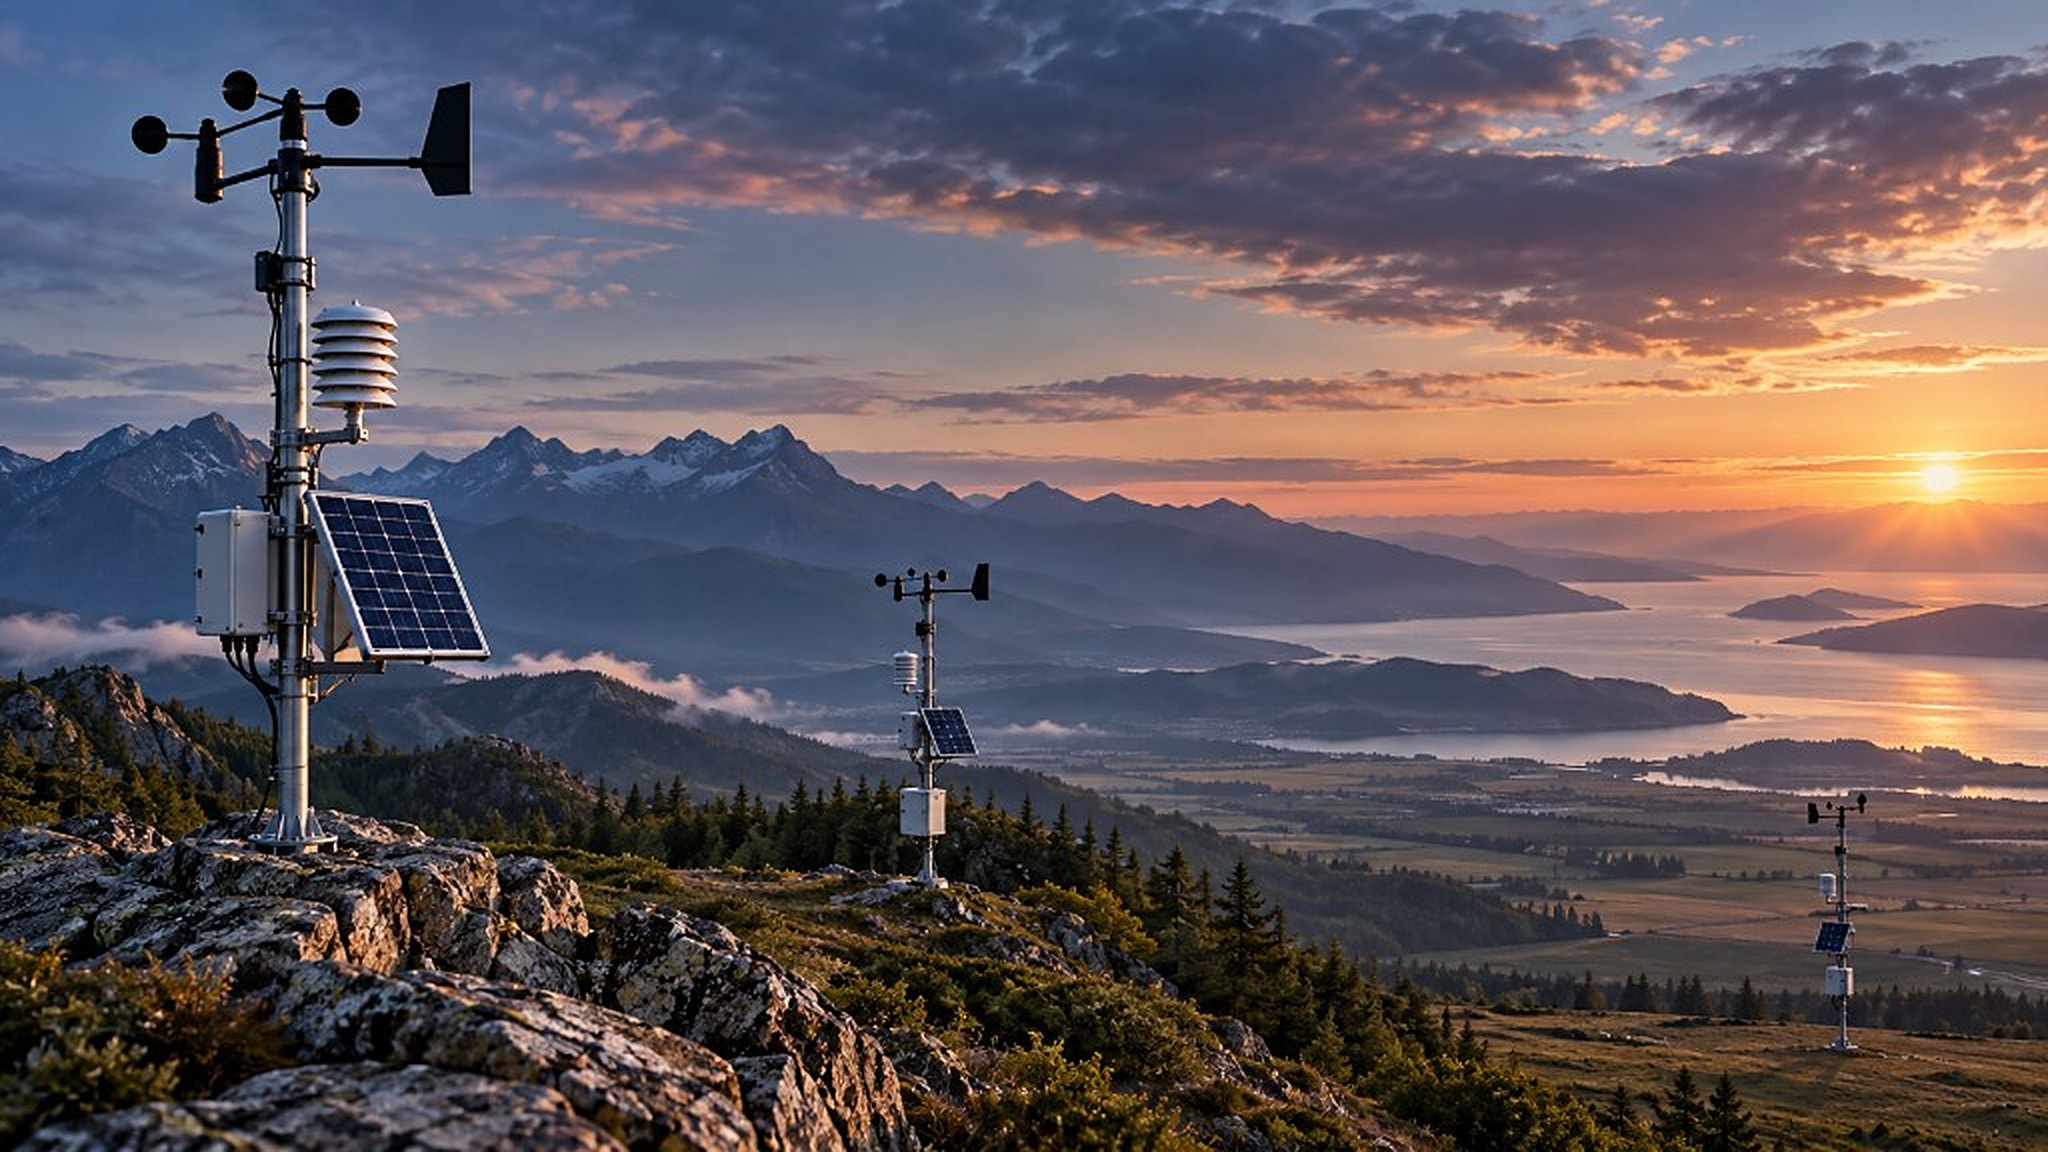
There is no simple way to tell whether a weather station can be trusted. Bad readings pass silently into every model built on them, and slow drift is the hardest kind to catch, because the numbers never stop looking plausible. That leaves traders, insurers and energy companies carrying a cost they cannot see.
What it delivers
Every station is measured against its own neighbours rather than a national average, which catches both sudden shifts and slow drift. The output is one ranked priority list covering the US station network, delivered as an on-demand report, so a team knows exactly which stations to review first.
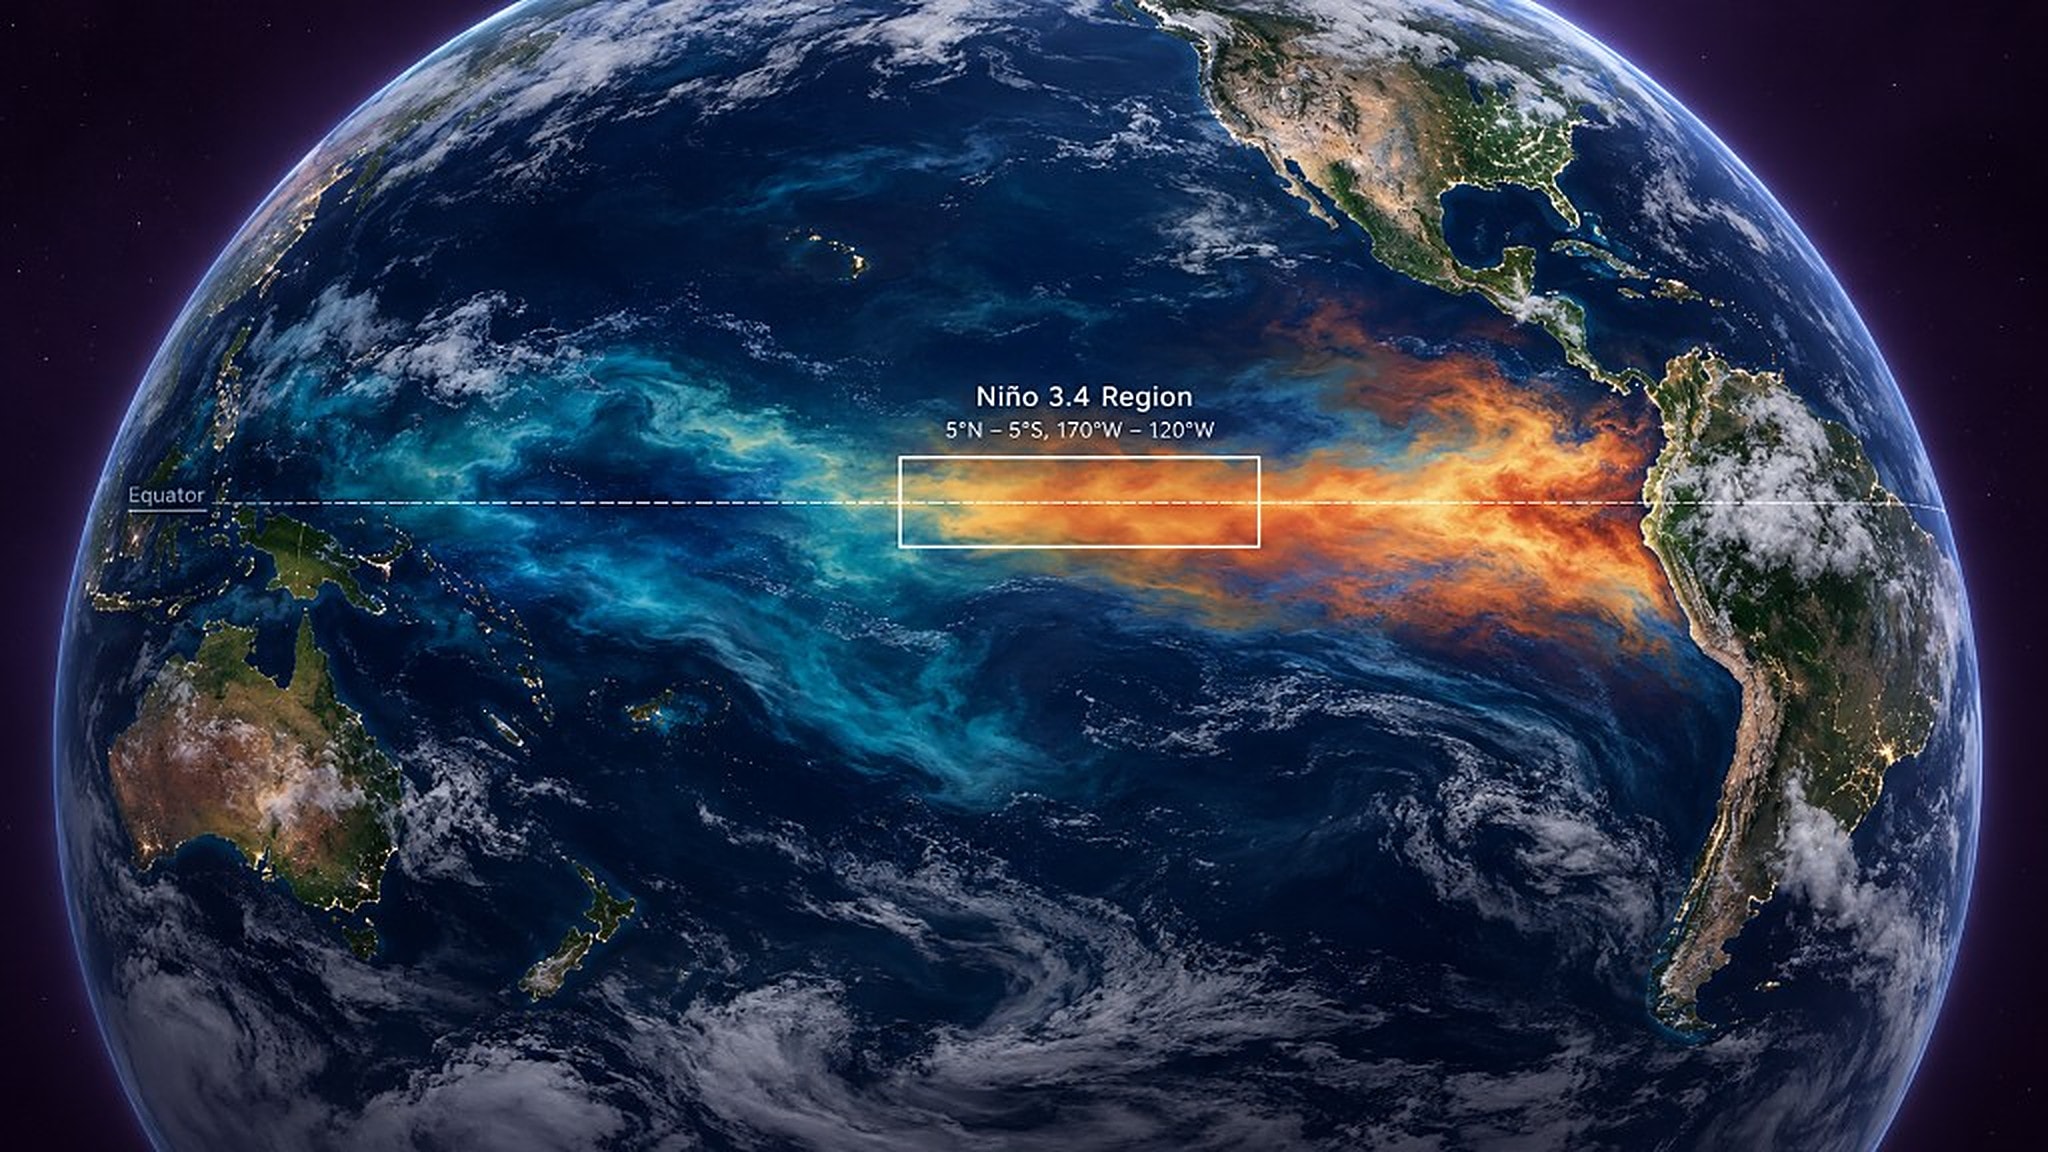
El Niño drives extreme winters and takes gas and power demand with it. Standard forecasts arrive too late to position against, lose reliability through spring, and the cycle is irregular enough that calling it early is genuinely difficult — which is expensive for traders, insurers and energy companies.
What it delivers
We read how unsettled the Pacific was the year before to flag a developing El Niño well ahead of standard models, and report it as a single clear call rather than a hedged narrative. The method is tested against decades of history, delivered as an on-demand report.
Production and storage sit in separate datasets, rig counts and output move on a lag, and storage shifts with both season and power burn. Put together carelessly the result is easy to mistake for a full supply balance, and because the workings stay buried in a spreadsheet it is hard to audit and harder still to reproduce the same way twice.
What it delivers
Twelve months of production and storage in one table — production tied to rig activity, storage built from seasonal history, each path calculated separately so neither gets mistaken for a full supply balance. Every step is transparent and auditable, and the whole report regenerates from a single command.
Every project is a working platform rather than a one-off study: it reads public data, produces a result, and can be run again whenever the data moves. Each one ends in a report you can act on — a ranked list, a single forecast, a supply view — not a folder of charts to interpret.
Because the workings stay visible, you can see exactly how a number was reached and reproduce it yourself.
How we build
AI speeds up the work, people sign it off
Each project needs its own mix of data, backend, frontend and infrastructure work, and we use the tools that fit it. AI coding assistants such as Claude and Cursor let a small team move at the pace of a much larger one. A tracked plan and code history, in Azure DevOps, Jira or whatever the client uses, means every change is tracked and approved.
The platforms on this page happen to run on Microsoft Azure; client work runs on the cloud or servers the client already has. Nothing reaches a client report without a person reviewing it first.
Our workflow at a glance
01
Plan
Azure DevOps, Jira or yours
Agree what success looks like before any code is written
We start from your question and turn it into a written plan: which data the work will use, what the finished report must show, and how we will know the result is right. Each piece of work becomes a tracked item with an owner and a priority, so there is always a record of what was asked for and why.
02
Build
AI-assisted: Claude, Cursor and others
Code, tests and documentation come out of the same pass
Our engineers work alongside an AI development environment. The usual way is one step after another — write the code, then the tests that check it, then the documentation that explains it. Here all three are produced together, which removes most of the waiting between steps and is how a small team delivers platforms the size of the ones on this page.
03
Review
Human
Nothing is released until an engineer has signed it off
A person reads every change, reruns the analysis, and checks the numbers against the source data they came from. If anything looks off, it goes back to the build stage. No figure reaches a client report without someone putting their name to it.
04
Deploy
Azure, AWS, Google Cloud or on-premises
The finished platform runs as a managed cloud service
Once approved, the platform goes live on the client's own cloud or servers. Reports refresh when new data arrives or when you ask for them, on infrastructure that is monitored and grows with the workload — nothing depends on a single person's laptop.
Our office
Based in Vancouver, Canada
The office is here. The work is not limited to Vancouver. We work with energy and commodity trading firms in other markets. Email, call, or ask for a consultation.