
Rossby Energy
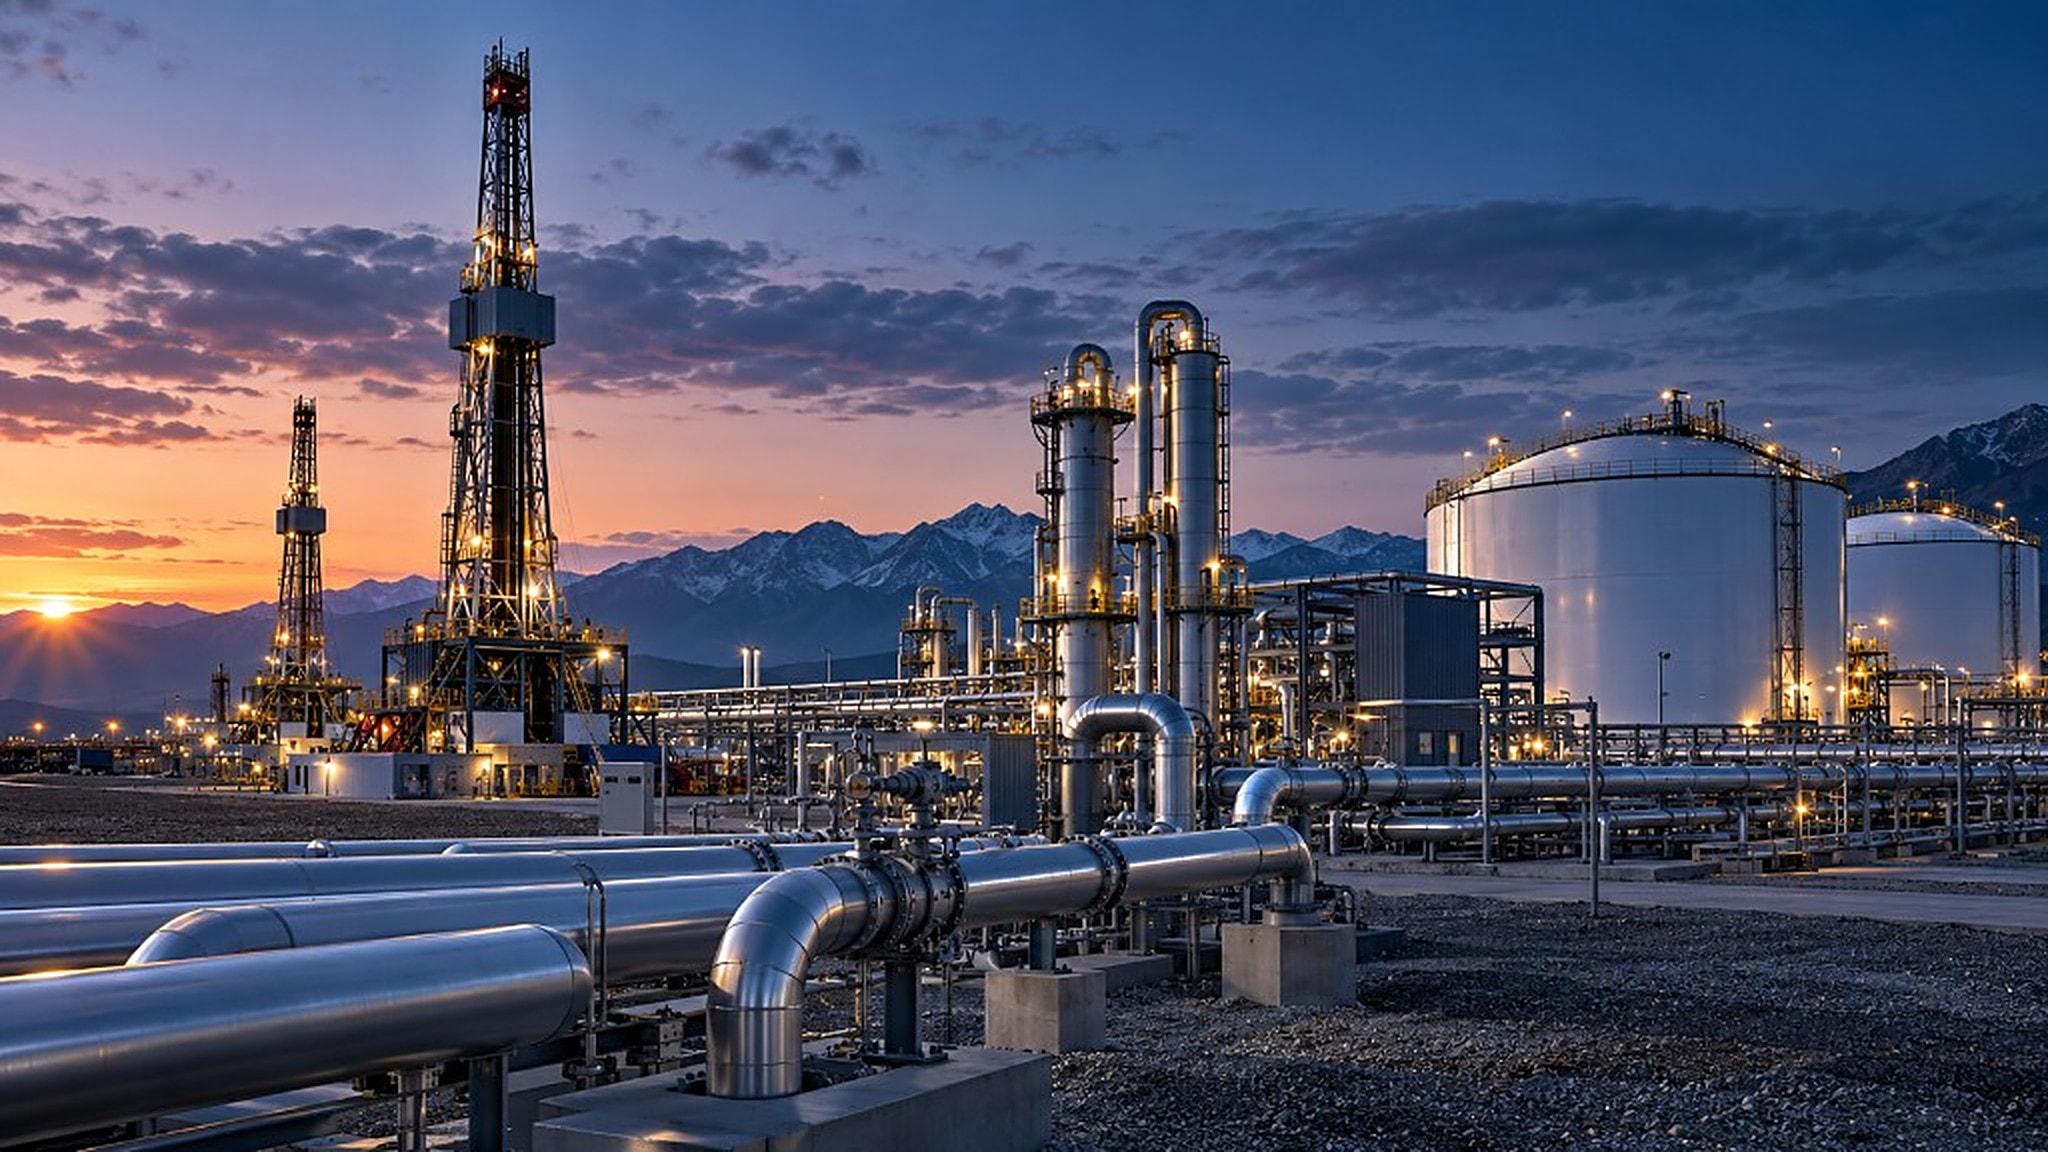
Natural gas processing plant with pipelines and storage tanks at dusk
All projects

Natural Gas Supply Forecasting Platform

A year of gas production and storage, on one page

Production and storage move for different reasons, so combining them usually means a spreadsheet nobody else can check. This platform forecasts both for twelve months in one table, with every step shown.

Built on public EIA records, frozen 13 August 2026. Two independent forecasts, not a full supply balance.

Forecast horizon
12 months

Sep 2026 through Aug 2027

Production averaged
110.77

Bcf/d of Lower-48 dry gas

Storage at Aug 2027
3,221

Bcf of working gas, from a measured level

Built from
5 series

Public EIA data, frozen 13 August 2026

How the forecast is built

Two separate calculations, printed in one table

Forecast production from rig activity

Output from wells already drilled fades at a rate that can be measured, and new rigs add to it on a lag. Those two habits, learned from a decade of past months, are enough to step production forward from the last figure EIA actually published.

Lower-48 dry gas production, month by month
Sep 2026109.93 Bcf/drange 103.71 – 116.144 months aheadSTEO111.69(−1.76)A year earlier 107.33
Sep 2026Oct 2026Nov 2026Dec 2026Jan 2027Feb 2027Mar 2027Apr 2027May 2027Jun 2027Jul 2027Aug 2027
Our path, Lower-48Range, widest in Aug 2027EIA STEO, total U.S. including AlaskaThe month’s gap, −3.60 on averageHover, tap or use the arrow keys to read any month.
  1. Learn the habits135 monthsHow fast output fades on its own, and how much a working rig adds, learned from Mar 2015 – May 2026.
  2. Start from the last real month109.32 Bcf/dMay 2026, as published by EIA. Everything after this point is built on it.
  3. Hold rigs flat557 rigsThe last count, from Jun 2026, carried forward unchanged. An assumption, not a forecast of drilling.
  4. Step forward12 monthsOne month at a time, each one building on the month before it.
  5. Widen the range1.585 Bcf/dThe typical miss on past months, opened up further the longer the forecast runs.

Data noteExact values from the report. The range covers past scatter only — it excludes the flat-rig assumption and uncertainty in the coefficients themselves, so a true interval would be wider than the one shown.

Project storage from a measured level

Storage is not forecast from production. It starts at the last weekly inventory reading, then moves by what a normal year does to storage in each of those months, adjusted for how hard gas has recently been burned for power.

Working gas in storage at the end of each month
Oct 20263,943 BcfFilling+355 Bcfon the month beforeHighest point of the cycle
Sep 2026Oct 2026Nov 2026Dec 2026Jan 2027Feb 2027Mar 2027Apr 2027May 2027Jun 2027Jul 2027Aug 2027
Gas going inGas coming outPeak 3,943 Bcf in Oct 20261,974 Bcf comes back out by Mar 2027Starts from 3,153 Bcf measured on 7 August 2026Hover, tap or use the arrow keys to read any month.
  1. Start from a measured level3,153 BcfThe weekly reading for 7 August 2026. Measured, not modelled.
  2. Bridge to the end of the month3,270 BcfThe rest of the month walked out at the usual pace for those weeks.
  3. Add a normal year2021 – 2025The average change across the same weeks of the last five years, month by month.
  4. Nudge for recent weather+5.19%Power burn ran above normal over the 28 days to 13 August 2026, which holds storage back a little. Applied to Sep – Nov 2026 only.

Data noteExact values from the report. This is a seasonal projection from a measured inventory level, not a balance of supply against demand. Two months sit above anything recorded in those calendar months over the five-year baseline, and are shown as computed rather than clipped.

Put both in one table you can check

Every month is printed with its range, the equivalent EIA figure, the gap between them and what the same month did a year earlier. Nothing is summarised away, so a reader can disagree with a specific number rather than with the result as a whole.

Production forecast

Stepped forward from the last published month, driven by rig activity

Storage projection

Walked forward from a measured inventory level, driven by the season

The two columns are calculated independently of each other. Changing the production forecast would not move a single storage figure. This is a table of two separate results, not a supply and demand balance.

Month 1 of 12

Sep 2026

Ours

109.93

Bcf/d

Ours − STEO

−1.76

Bcf/d

A year earlier

107.33

Bcf/d

Storage

3,588

Bcf

MonthOursRange, 95%EIA STEOOurs − STEOA year earlierStorage
Bcf/dBcf/dBcf/d, total U.S.Bcf/dBcf/d, publishedBcf, end of month
Sep 2026109.93103.71 – 116.14111.69−1.76107.333,588
Oct 2026110.08103.13 – 117.03112.22−2.14106.373,943peak
Nov 2026110.23102.62 – 117.84112.93−2.70109.273,891
Dec 2026110.39102.17 – 118.61113.89−3.50110.593,420
Jan 2027110.54101.76 – 119.33114.15−3.61107.722,637
Feb 2027110.70101.38 – 120.02113.02−2.32109.642,078
Mar 2027110.85101.03 – 120.67114.91−4.06109.711,969low
Apr 2027111.00100.70 – 121.31115.17−4.17109.932,195
May 2027111.16100.40 – 121.92115.54−4.38109.322,608
Jun 2027111.31100.11 – 122.51115.96−4.65—2,919
Jul 2027111.4699.84 – 123.09116.37−4.91—3,070
Aug 2027111.6299.58 – 123.65116.61−4.99—3,221

Hover or tap a month to read its figures above the table. A dash means EIA had not published that month when the data was frozen. Those cells are left empty rather than filled from the model, which would let the forecast appear to check itself.

Data noteExact values from the report. The production and storage columns are computed independently of each other. Year-ago cells are blank where EIA had not published that month at the freeze, and are never filled from the model.

How it works

A forecast you can take apart

Most supply views arrive as a number with a method you have to take on trust. This one arrives with its working shown: the data it was built from, the assumptions it leans on, and the places it is likely to be wrong. Run it twice on the same inputs and the output is identical to the byte.

  1. 01

    Freeze the inputs

    5 public EIA series — production, drilling, storage, power burn and EIA's own outlook — are taken as a dated snapshot and fixed. Nothing moves underneath the result afterwards.

  2. 02

    Forecast production from drilling

    Wells already drilled fade at a measurable rate, and new rigs add to output on a lag. Both habits are learned from 135 past months and used to step forward from the last published figure.

  3. 03

    Project storage from the season

    Storage starts at the last measured inventory reading and moves by what a normal year does in each of those months, adjusted for how hard gas has recently been burned for power.

  4. 04

    Print the workings

    Every input, setting and assumption is written into the same document as the result, so a reviewer can follow a number back to the data it came from without asking for anything else.

What you get

A12 months, month by month
Production and storage for each month ahead, with a range on every production figure and EIA's own outlook alongside for comparison.
BThe workings, in full
The data each number came from, the settings used, and the assumptions made — including the ones that would widen the range if they were priced in.
COne command, one file
The whole report regenerates from a single command into one self-contained file that opens in any browser, with nothing to install and nothing to connect to.

A finished report, not a live feed. One forecast built from a dated snapshot of public EIA data and rendered to a single self-contained file. Two runs on the same inputs produce byte-identical output, so every number on this page can be reproduced exactly.

Where it sits against EIA. Over the 12 months our path averages 110.77 Bcf/d against EIA’s 114.37, a gap of 3.60. Ours covers the Lower-48 and EIA’s covers the whole country including Alaska, so the comparison is a sanity check with a known gap built into it, not a scorecard.

Line drawing of downtown Vancouver from above False Creek: Stanley Park, the Lions Gate Bridge, the towers, Canada Place and BC Place, with the North Shore mountains behind

Our office

Based in Vancouver,
Canada

The office is here. The work is not limited to Vancouver.
We work with energy and commodity trading firms in other markets.
Email, call, or ask for a consultation.